![logo icon white.png]](https://help.hijiffy.com/hs-fs/hubfs/logo%20icon%20white.png?width=50&height=50&name=logo%20icon%20white.png)
The report can be filtered by dates and conversation opening time
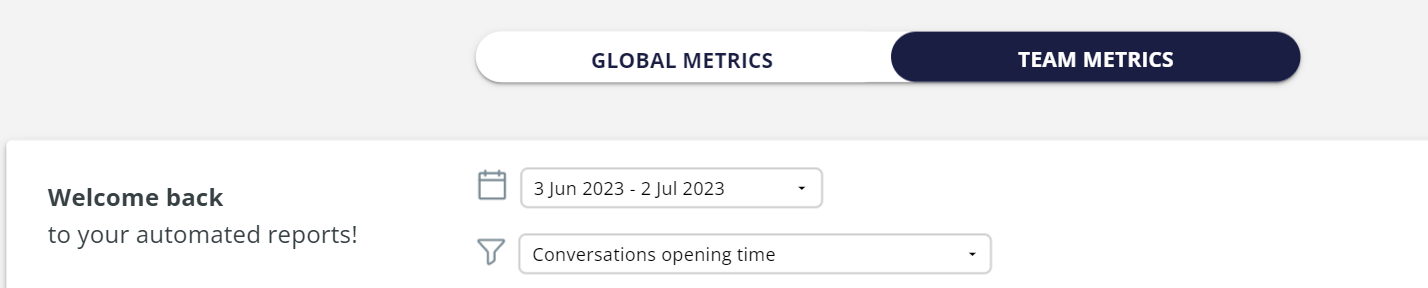
- From 9AM-7PM (Mon-Fri): conversations that were transferred to the console from 9AM to 7PM, from Monday to Friday (most common working hours for most clients)
- From 7PM-9AM (Mon-Fri) / Sat-Sun: conversations that were transferred from 7PM to 9AM from Monday to Friday and conversations transferred on Saturday and Sunday (most common Offiline hours for most clients)
Team Metrics
Team Performance

The time is displayed in hours:minutes:seconds (example below: 3 hours, 28 minutes and 0 seconds in average)
- Average Time for first reply: How long does it take for an agent (in average) to provide a first reply (as soon as the conversation is transferred to the console - open tab, inbox menu)
- Number of first replies: This metric counts the number of first replies that were given
- Number of resolutions: Total number of conversations that were closed (marked as closed)
- Average resolution time: Average time to close a conversation (from the moment the conversation is transferred until it is marked as closed)
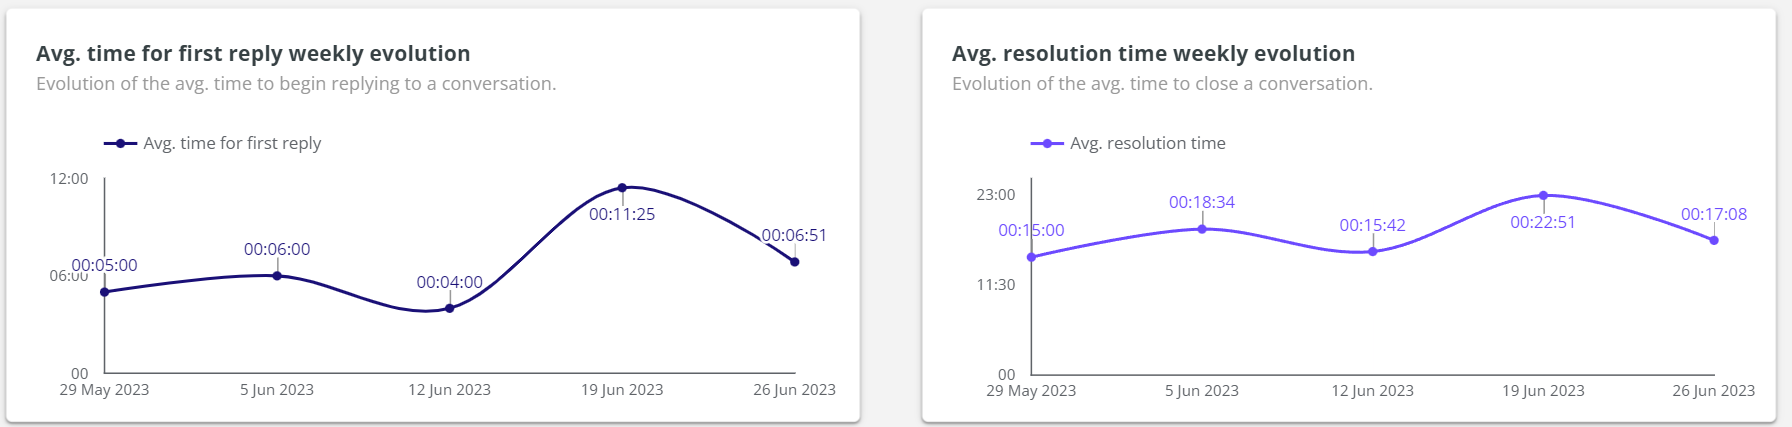
Team Performance Evolution
- Average time for first reply and resolution time evolution shown in a graph by week: the lower, the better
- Elapsed time for first reply and Resolution elapsed time:
- Elapsed Time for first reply:
In the total amount of conversations (100%), what is the percentage of conversations that received a first reply in the time period defined.
Example: Below we can see that 33.8% of total number of conversations received a first reply between 1 and 5 minutes after the conversation was transferred to the console.
-
- Elapsed Time for resolution:
In the total amount of conversations (100%), what is the percentage of conversations that were "marked as closed" in the inbox menu, in the time period defined.
Example: Below we can see that 15.7% of total number of conversations were closed between 1 and 5 minutes after the conversation was transferred to the console.

Customer Satisfaction
How happy are your guests with the replies received by your agents and their performance, in %.
Agent CSAT

When a guest replies to the feedback questions, an automatic tag is created called Agent CSAT good or Agent CSAT bad, according to the rating your guests have given.
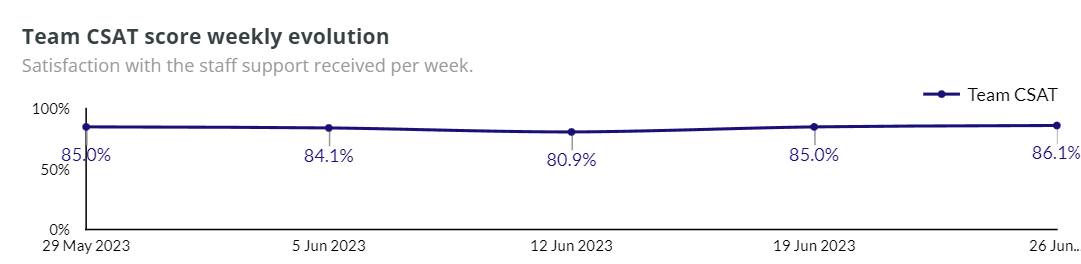
Team CSAT score weekly evolution
Weekly evolution of the satisfaction with the agents' support received
Agents Individual Performance
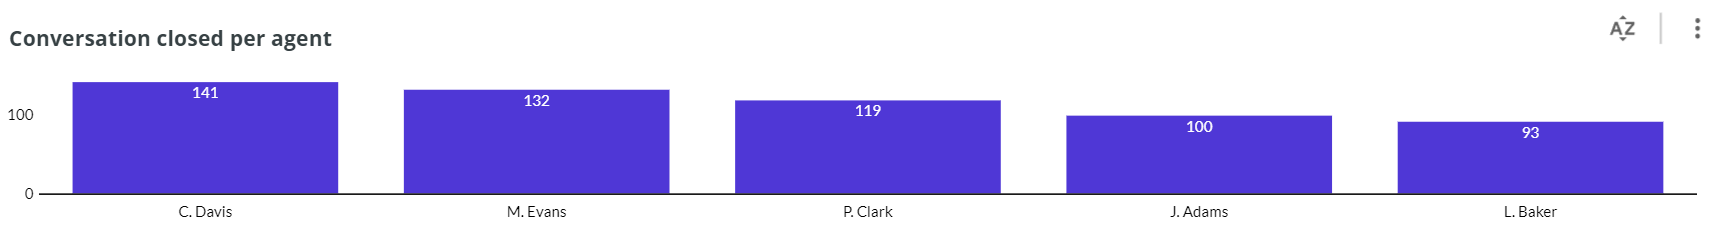
Conversations closed per agent
The number of conversations closed by each agent
Perfomance by agent
In the table below you can see the same information shown above, per agent:
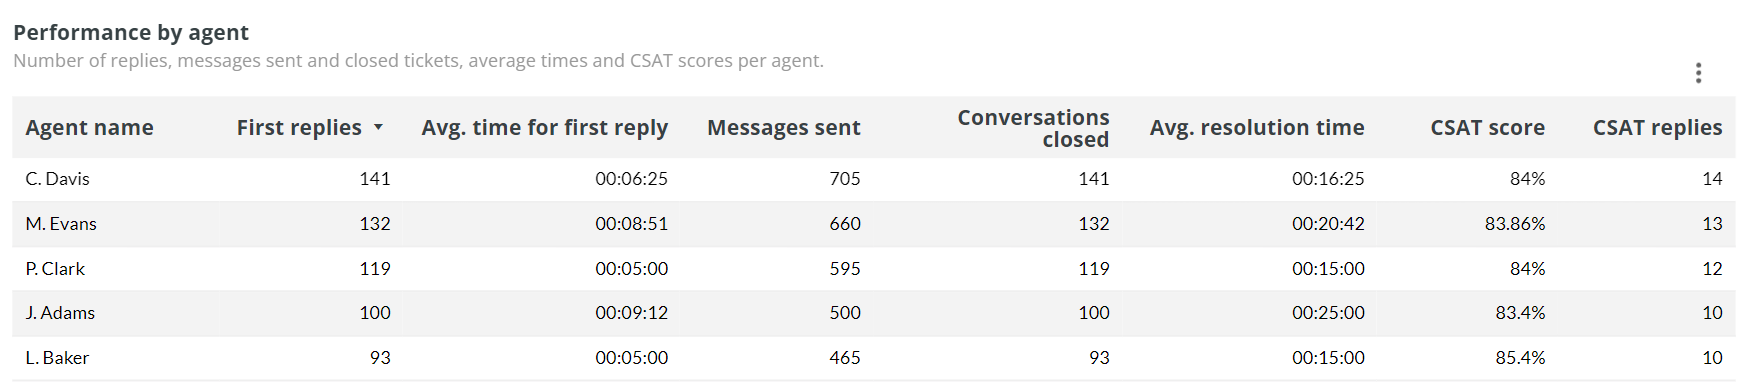
- First replies: how many first replies each agent has given
- Average Time for first reply: how long did it take for each agent to provide a first reply (in average)
- Messages sent: total number of messages that were sent by each agent
- Conversations closed: total number of conversation that were closed by each agent
- Average Resolution time: how long did it take for each agent to mark the conversation as closed (open tab, inbox menu)
- CSAT Score: what is the feedback of the guests in regards to each agent's replies. The results are shown in percentage
- CSAT Replies: the number of replies that were given in regards to the performance of each agent
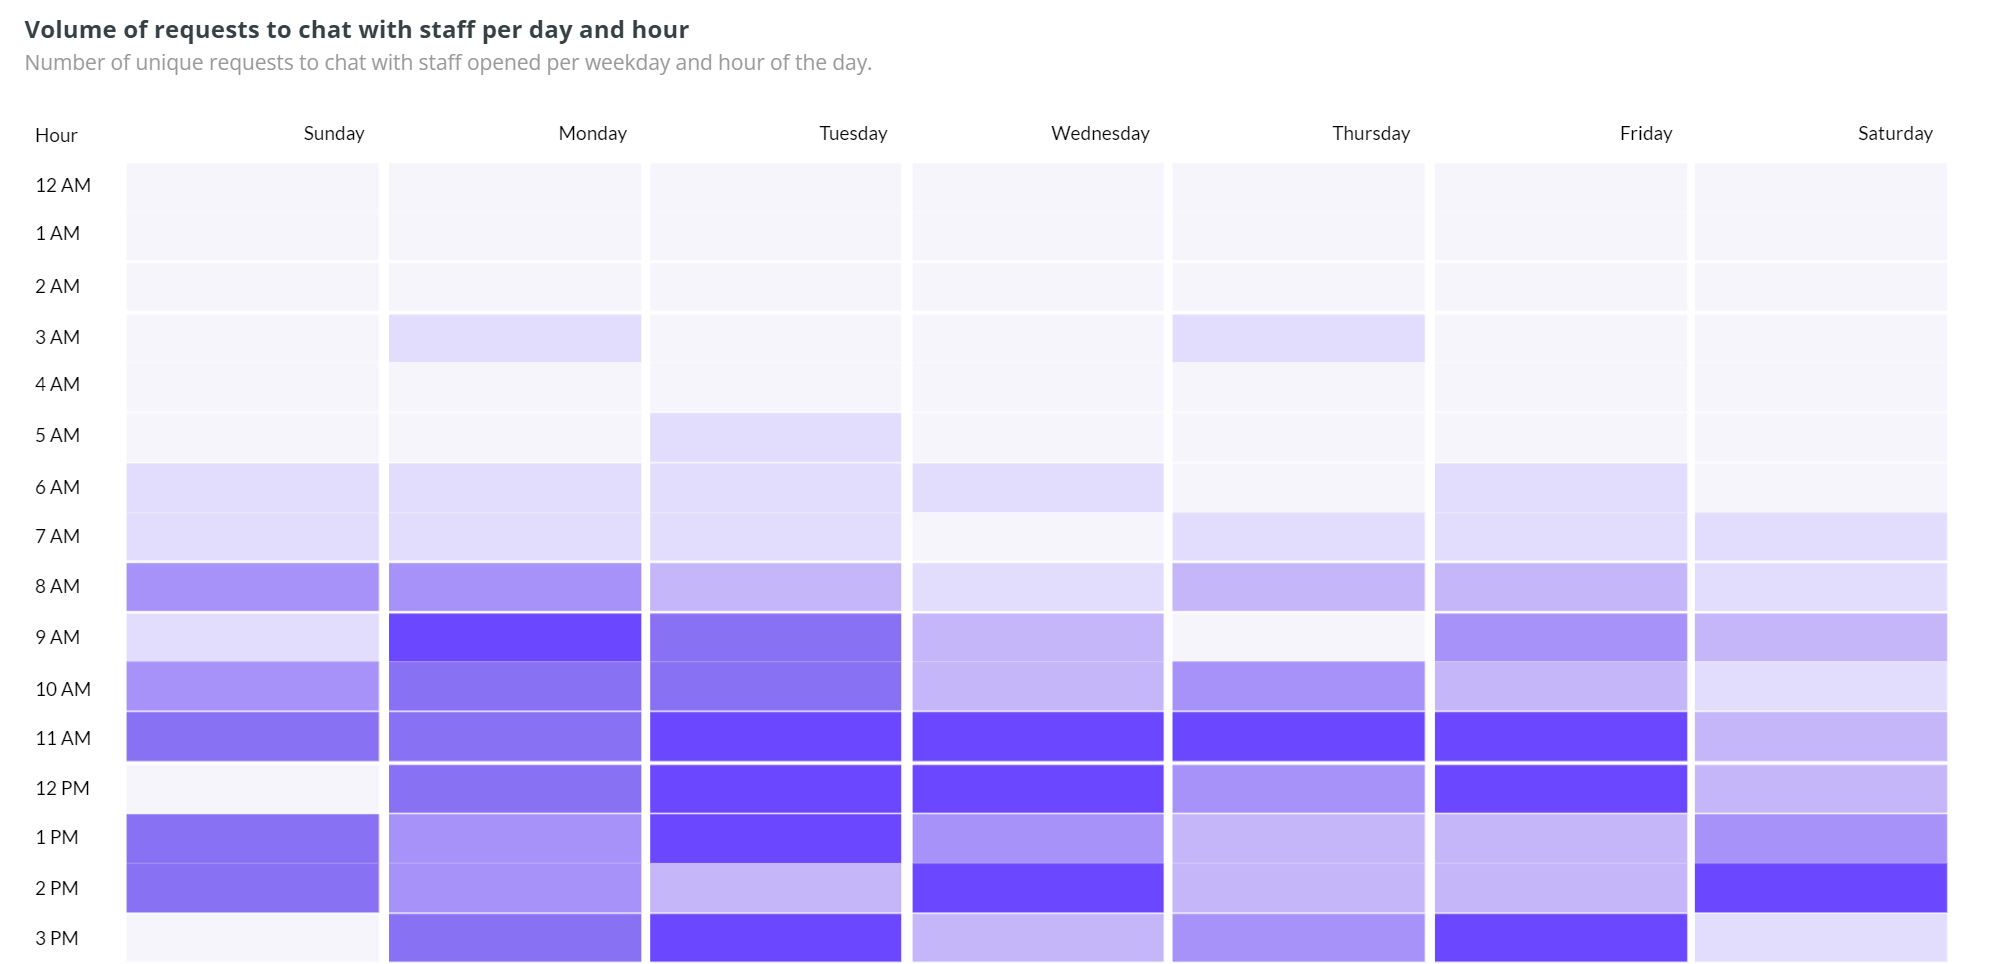
Activity Map
This map shows the number of unique requests to chat with staff opened per weekday and hour of the day.